
Below is one example of analyzing heap dump to know which objects are responsible for JVM out of memory.
How to get JVM Heap dump?
- One way is to have java option option
—XX:+HeapDumpOnOutOfMemoryError, which trigger heap dump when JVM is out of memory -
Another way is to use
jmap(available from JDK 1.6 but can also be used on JVM with 1.4+). First, find the java process id usingjps.bash-4.1$ jps 24437 Jps 11036 WrapperSimpleAppor you can also use
ps -efto get the java process id.-bash-4.1$ ps -ef | grep java app 11036 11034 3 05:07 ? 00:26:49 /usr/lib/jvm/jdk1.6.0_151/bin/java -Xms6g -Xmx6g -XX:NewSize=3g -XX:MaxNewSize=3g -XX:PermSize=512m -XX:MaxPermSize=512m -XX:ThreadStackSize=512 -Duser.timezone=US/Central -XX:SurvivorRatio=8 ...Once you know the process id, use below command to generate heap dump.
# jmap -J-d64 -dump:format=b,file=<filename>.hprof <jvm-process-id>
bash-4.1$ jmap -J-d64 -dump:format=b,file=heapdump`date +%m%d%y%H%M%S`.hprof 11036
Analyzing heap dump using Eclipse Memory Analyzer
Download Eclipse Memory Analyzer (For 64 bit OS get 64 bit version)
Note: Depending on the heap size dump you need to increase the vm size of Eclipse MAT To increase size in Mac OS X, Right click on MemoryAnalyzer (application) then “Show Package Contents”. Edit — MemoryAnalyzer.app/Contents/MacOS/MemoryAnalyzer.ini.
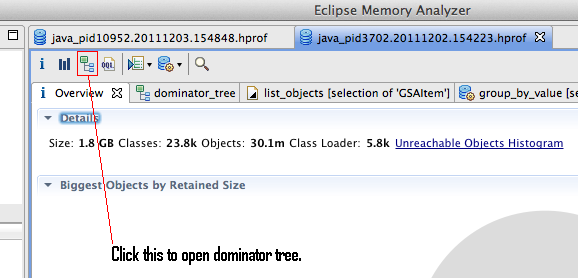
In the below example — size of the heap dump is 1.8 GB, and Eclipse MAT VM size is “3048m” and instance VM size (from which the heap dump is generated) is 2560m.
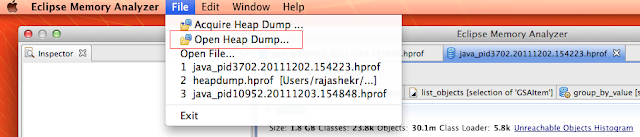
Open heap dump -
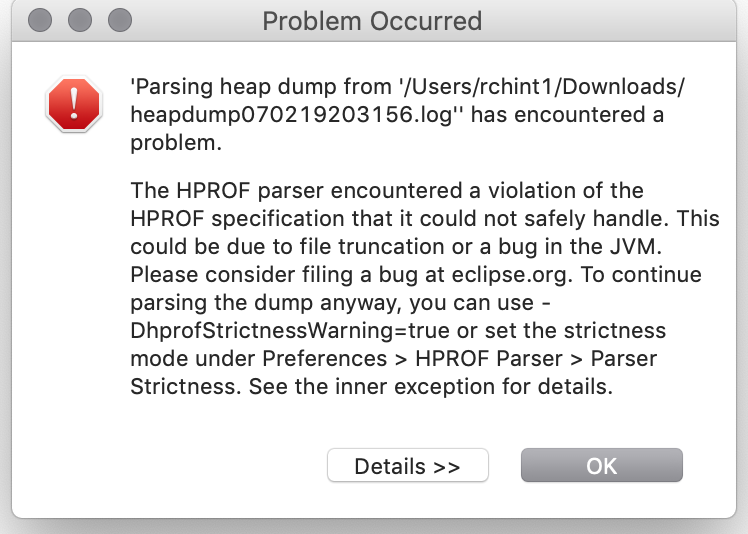
Note: If you have seen below error while importing the heap dump, then add -DhprofStrictnessWarning=true in MemoryAnalyzer.ini.
Open the dominator tree once the heap dump is loaded in Eclipse Memory Analyzer; refer below.
Select “Group by class”
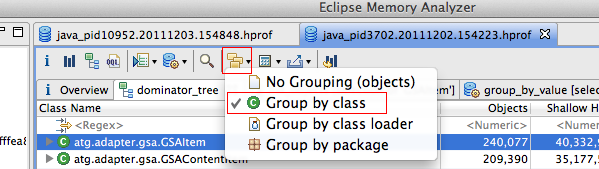
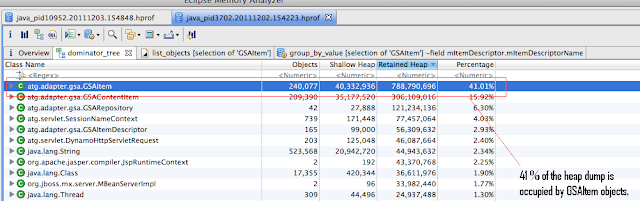
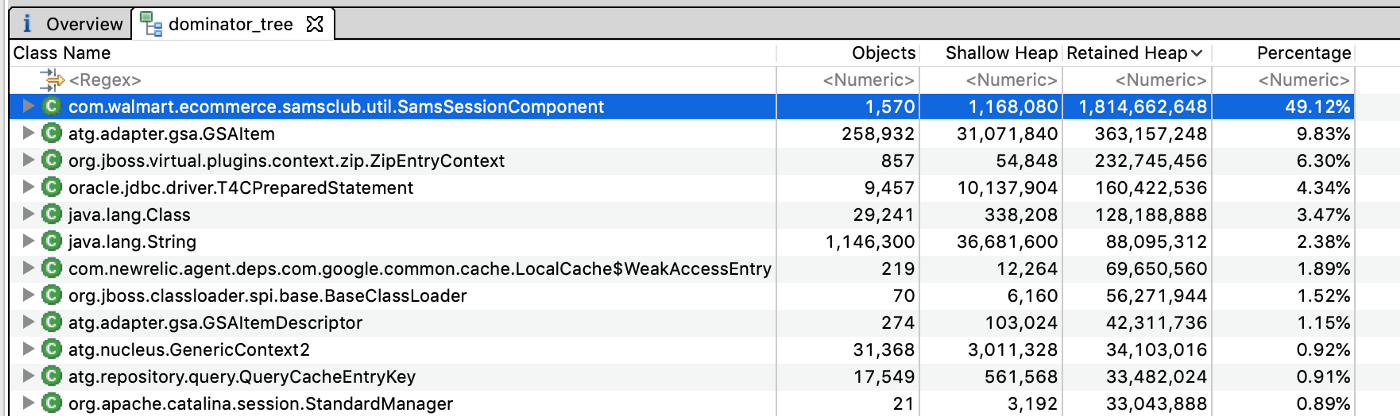
Here, you can know what objects occupied much of the heap dump. For example — In the below scenario, GSAItem objects occupy 41% of the heap dump (788 MB of 1.8 GB)
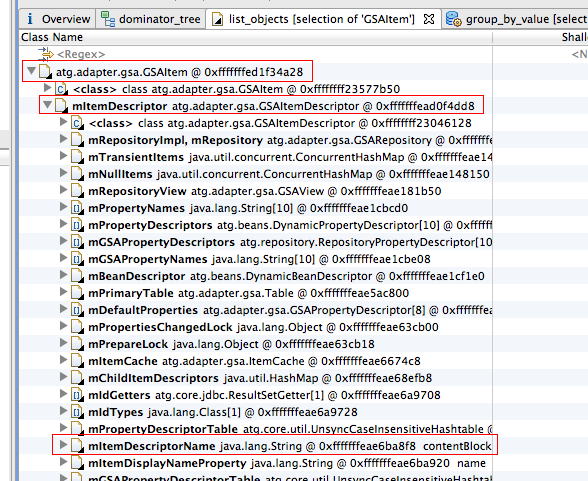
Once the objects are listed, to know what type of items.
In GSAItem object, mItemDescriptor.mItemDescriptorName will give the name of the GSAItem.
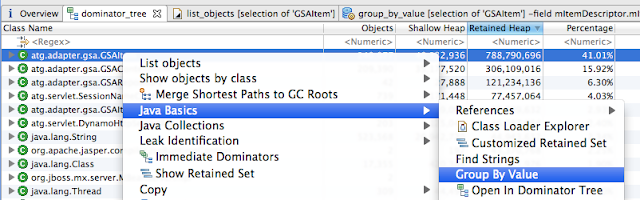
We need to group by value “mItemDescriptor.mItemDescriptorName” on Class atg.adapter.gsa.GSAItem (in dominator_tree). So go back to dominator_tree tab, right click on atg.adapter.gsa.GSAItem -> Java Basics -> Group By Value.
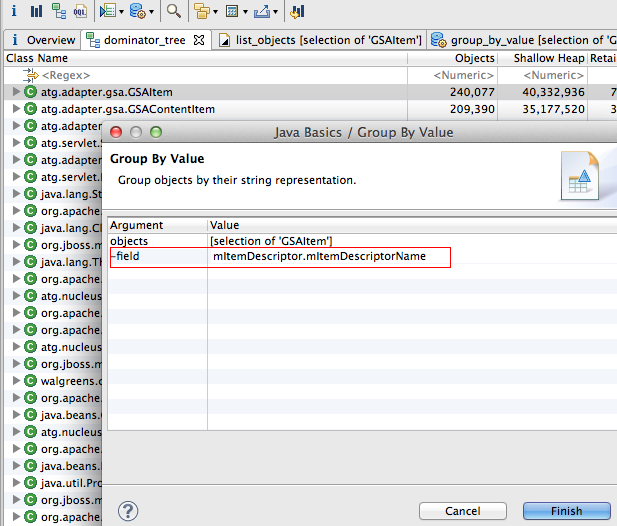
In Group By Value window, fill the field with “mItemDescriptor.mItemDescriptorName” and click finish.
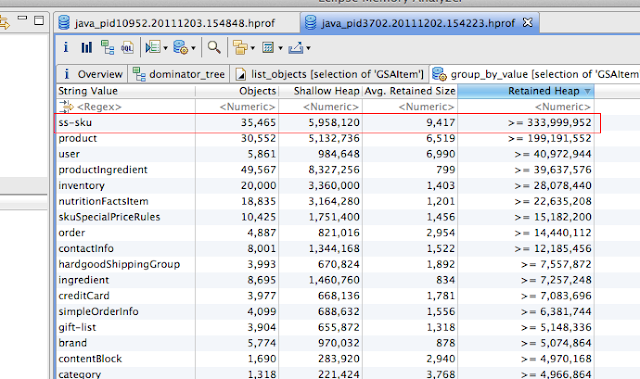
Depending on the number of objects it needs to parse, this will take time. Once it is done, you can see which type of items (GSAItems) take more space in JVM heap space. (sort it by Retained Heap) In the below scenario, ss-sku items took 333 MB of JVM heap space, and the number of ss-sku items in memory are 35,465 (i.e 35,465 items are cached in memory)
For example, another heap dump, 1570 SamsSessionComponent Objects, took 49%. (1.8 GB of 3.4 GB)
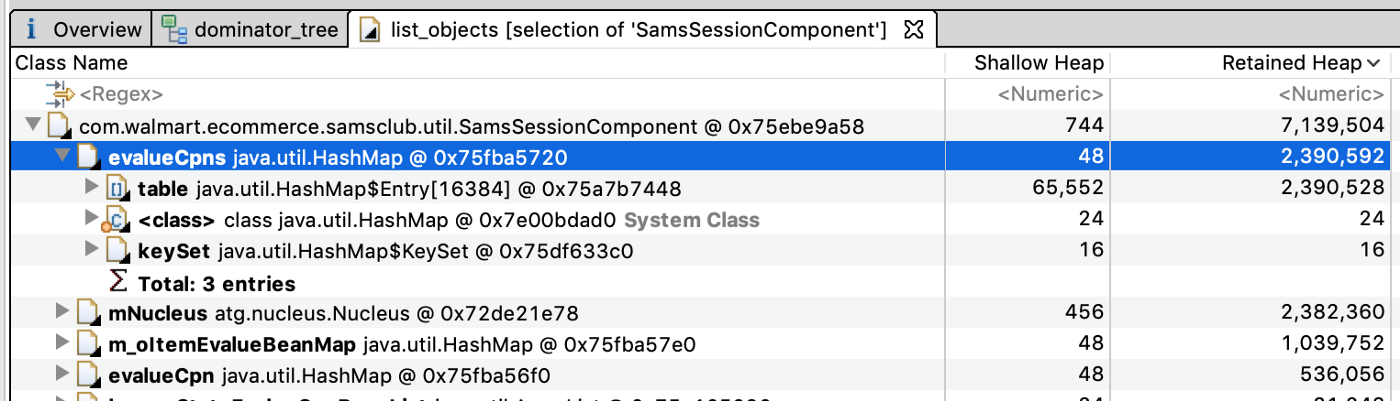
You can also check which properties (or references) are taking much space in each object. In the below example, each SamsSessionComponent object took 7 MB; 2 MB is taken by evalueCpns property.
In the above way, we can identify which objects take up much memory in JVM. – RC


Comments